Logging Events
Contents
About Events & Categories
Events are diary entries with a descriptive text of any length, like a paragraph or a page in a physical diary. Events have a time and date, and may or may not be related to or have an impact on the tracked symptoms.
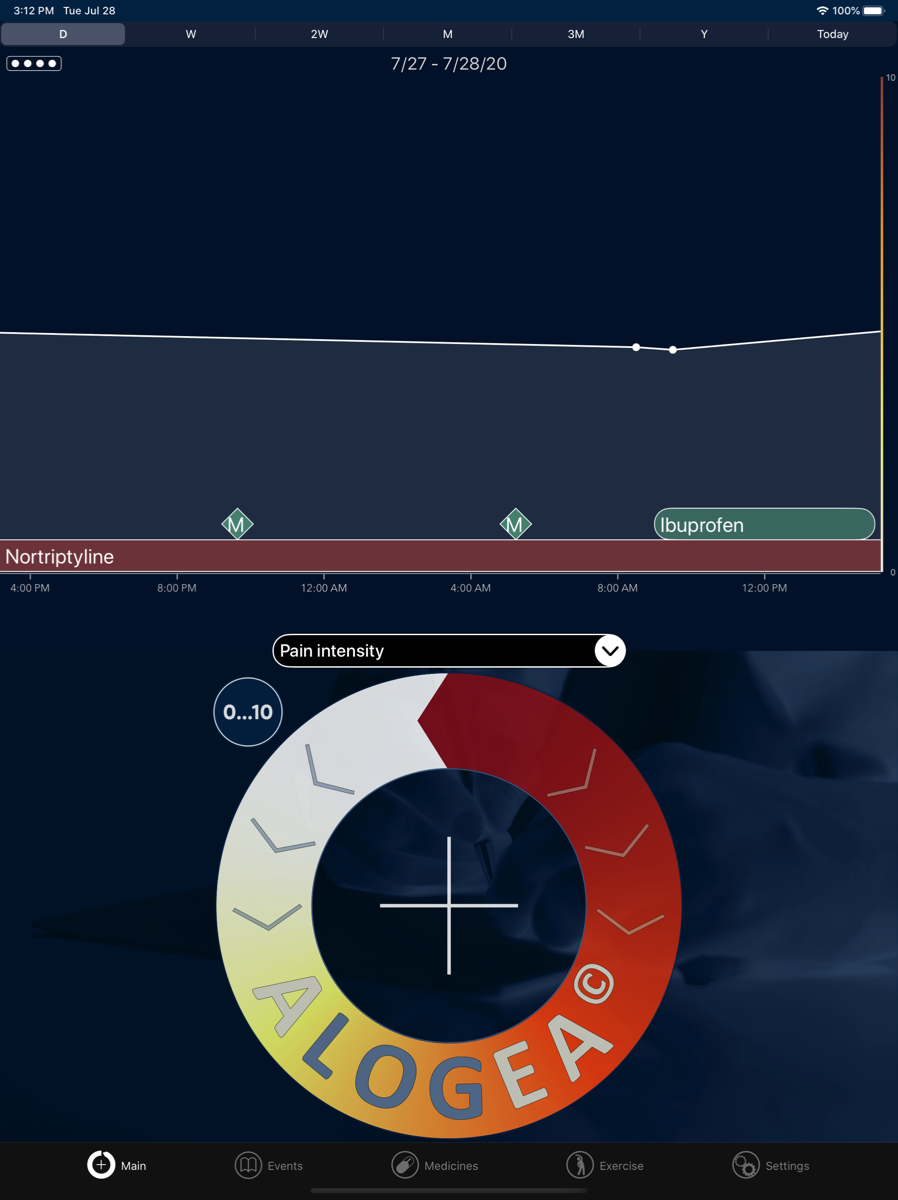
Events are displayed in the Main View timeline (as diamonds), as well as as a sorted list of events in the Events View.
In order to group events they have a category. You can create and modify event categories freely.
While you can record any type of event you like, think a bit about how to structure your diary at the beginning.
Alogea uses event categories to analyse any potential impact on symptoms. Create at least some categories for the purpose of determining or tracking their impact on symptoms.
Some examples for Categories are
- Physiotherapy sessions
- Pilates group
- Mindfulness sessions
- Work events
- Weather
- Personal Milestones
- Treatment events
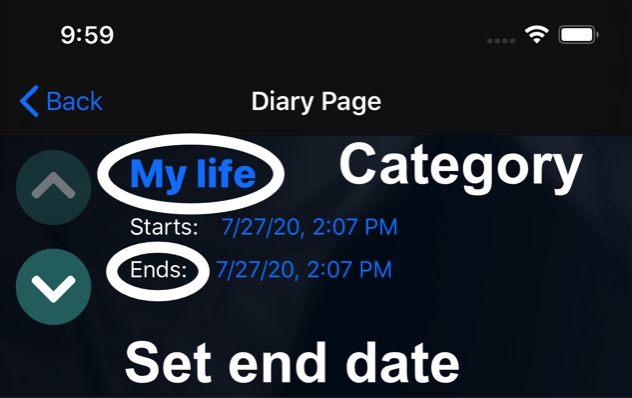
Events can be 'momentary' (have one date only) or have a time duration between two dates.
For the latter set an event 'end' date/time separately in the 'Events' view Diary Page.
Alogea will calculate how your tracked symptom(s) change from directly before to directly after events of a Category to help you see the impact.
For the latter set an event 'end' date/time separately in the 'Events' view Diary Page.
Alogea will calculate how your tracked symptom(s) change from directly before to directly after events of a Category to help you see the impact.
Adding, renaming and deleting event categories
Add a new category.
Navigate to the Main View and tap + in the centre of the Rating Circle.
Then tap the round + button (upper right ).
You will be prompted to enter a name for the new category.
Then enter a new event text to save the new category with this event.
A category must have a least one event to be saved.
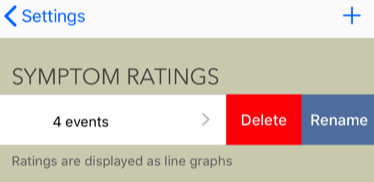
Rename or delete a category
Go to Settings > Symptom & Event Types. Swipe to the left in the row of the Category you want to rename or delete.
To rename enter a new and unique name.
Note that all events of this Category will be renamed (or deleted).
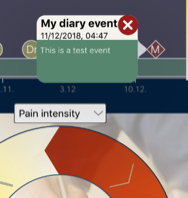
To delete individual events, tap on their diamond in the Time Line and then the red x in the upper left corner.
To delete multiple events, go to Settings > Symptom & Event Types.
Then tap on the category row for a list of all saved events of this category. Left-Swipe or tap on multiple rows and then tap the bucket to the top to delete.
Navigate to the Main View and tap + in the centre of the Rating Circle.
Then tap the round + button (upper right ).
You will be prompted to enter a name for the new category.
Then enter a new event text to save the new category with this event.
A category must have a least one event to be saved.
Rename or delete a category
Go to Settings > Symptom & Event Types. Swipe to the left in the row of the Category you want to rename or delete.
To rename enter a new and unique name.
Note that all events of this Category will be renamed (or deleted).
To delete individual events, tap on their diamond in the Time Line and then the red x in the upper left corner.
To delete multiple events, go to Settings > Symptom & Event Types.
Then tap on the category row for a list of all saved events of this category. Left-Swipe or tap on multiple rows and then tap the bucket to the top to delete.

Main option:
Navigate to the Main View and tap + in the centre of the Rating Circle.
From the next menu shown inside the Circle select 'Diary Entry' (yellow color).
In the new view select a category at the top and then an event description in the text box.
Hit 'save' at the right top of the keyboard to save, then select a time and date for the event.
You can see it as a diamond with the first letter of the category in the Time Line.
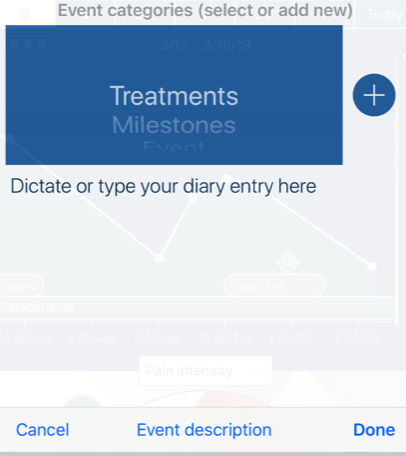
Second option:
Go to Events View (the list view) and tap + in the upper right corner. This will open a new Diary Page where you can enter text and change Category in the upper right corner (tap on the Category name).
Note: with this option you cannot backdate - the event will be saved 'now'.
Navigate to the Main View and tap + in the centre of the Rating Circle.
From the next menu shown inside the Circle select 'Diary Entry' (yellow color).
In the new view select a category at the top and then an event description in the text box.
Hit 'save' at the right top of the keyboard to save, then select a time and date for the event.
You can see it as a diamond with the first letter of the category in the Time Line.
Second option:
Go to Events View (the list view) and tap + in the upper right corner. This will open a new Diary Page where you can enter text and change Category in the upper right corner (tap on the Category name).
Note: with this option you cannot backdate - the event will be saved 'now'.
Where can I see events?
Time Line
Events will be shown as diamonds in the Main View Time Line.
Each category has it's own color, and the diamond shows the first letter of the category.
Tap on the diamonds to see your description.
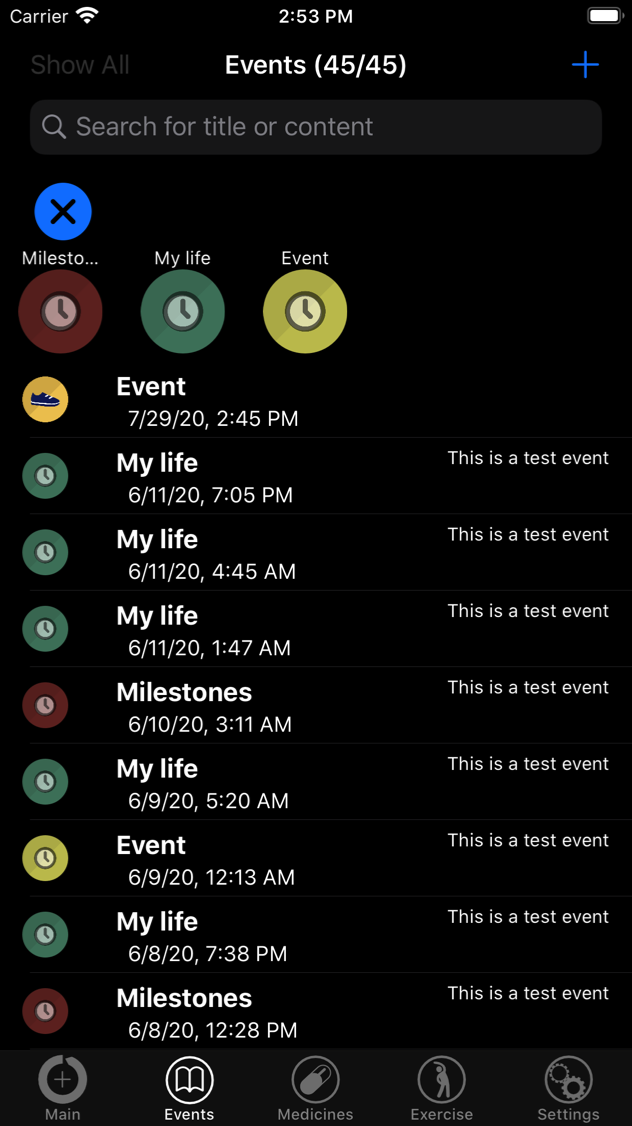
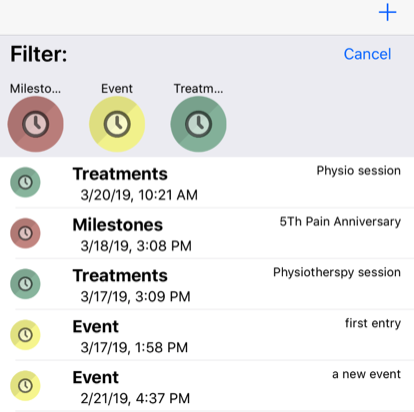
Event List and Diary Page
Go to Events to see events as a list, sorted by time.
Tap on a row to see more detail.
You can filter the list by category by tapping on 'Filter' and selecting one.
Events will be shown as diamonds in the Main View Time Line.
Each category has it's own color, and the diamond shows the first letter of the category.
Tap on the diamonds to see your description.
Event List and Diary Page
Go to Events to see events as a list, sorted by time.
Tap on a row to see more detail.
You can filter the list by category by tapping on 'Filter' and selecting one.
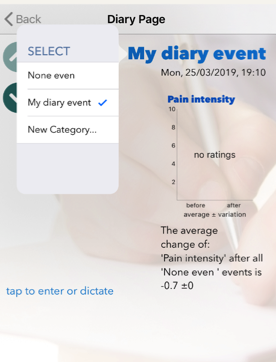
Can I see the impact of events on my symptoms?
Alogea will calculate how your tracked symptom(s) change from directly before to directly after events of a Category to help you see the impact.
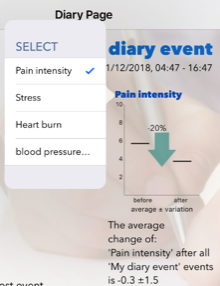
You can see this in the Events View after tapping on an event, as a Chart on the right side of a Diary Page.
If you track more than one symptom, you can change this by tapping on the symptom title above the chart.
The Chart may show a short horizontal line on the left and right side - these are the averages of ratings directly before and after events of this category.
If the lines are inside a blue box, this shows the variation of symptoms.
The arrow in the middle shows the change - downward and green for reduction and upward and red for increase. The larger the arrow the bigger the change. The % of change in relation to the maximum range value is shown above the arrow.
The text under the chart describes this change.
Events with green arrows should be helpful, those with red arrows seem to aggravate your symptom.
If you did not find an answer to your problem here please contact our support team:
support@apptoolfactory.co.uk
support@apptoolfactory.co.uk